The U.S. Environmental Protection Agency (U.S. EPA) finalized its guidance on Modeled Emission Rates for Precursors (MERPs) on April 30, 2019. MERPs are a tool for evaluating impacts on ambient air quality from the emission of secondary PM2.5 and ozone that will save air permit applicants time and money.
A Bit About Air Modeling
Dispersion modeling is a basic requirement of Prevention of Significant Deterioration (PSD) air permit applications. For pollutants that will be emitted in excess of certain thresholds, preliminary dispersion modeling is used to determine if ground-level concentrations will exceed significant impact levels (SILs). If the SILs are not exceeded, then the modeling demonstration is over. If the SILs are exceeded for any pollutant, then a refined modeling analysis is required.
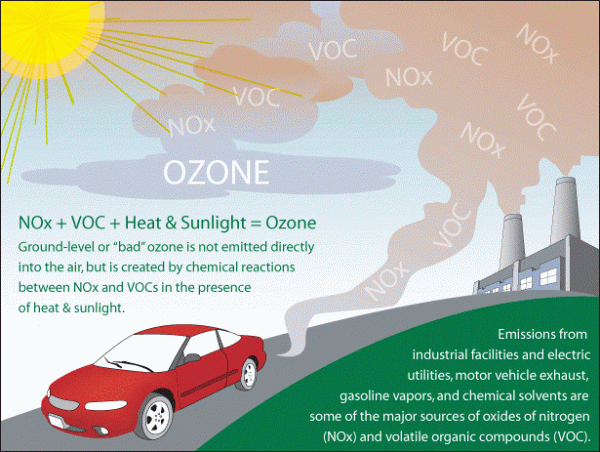
Modeling analyses are conducted for a variety of pollutants. Volatile organic compounds (VOCs), oxides of nitrogen (NOX), and sulfur dioxide (SO2) all act as “precursor” pollutants, meaning they contribute to the formation of other regulated pollutants, specifically, fine inhalable particles with diameters that are 2.5 micrometers and smaller (PM2.5) and ozone (O3). These “secondary” emissions of PM2.5 and O3 are formed in the atmosphere via photochemical reactions. NOX and SO2 contribute to PM2.5 formation, while NOX and VOCs contribute to O3 formation.
Due to the highly complex nature of the reactions involved, simple dispersion models such as AERMOD, the preferred short-range model of the U.S. Environmental Protection Agency (U.S. EPA), are unable to evaluate secondary PM2.5 or O3 formation. However, there are models that can: photochemical grid models such as CMAQ and CAMx or Lagrangian models such as SCICHEM. Because these models take a long time to set up and run, it is preferable to avoid using them for single-source permitting evaluations, if possible. However, U.S. EPA and state policies require that a quantitative analysis of secondary PM2.5 and O3 impacts be conducted for PSD permit applications. What’s the solution? This is where the MERPs come in.
What’s Covered in the MERPs Final Guidance?
Rather than force individual applicants to perform photochemical modeling, the U.S. EPA has done it for us. As presented in the guidance, the U.S. EPA performed photochemical model runs with an array of hypothetical sources in 113 locations across the continental U.S. to relate:
- VOCs and NOX emissions to O3 concentrations (eight-hour basis) and
- SO2 and NOX emissions to secondary PM5 concentrations (daily and annual basis).
Each hypothetical source was modeled at three emission rates: 500, 1000, and 3000 tons per year (tpy). Based on the precursor emission rates and the modeled maximum concentrations, MERPs were calculated to represent the precursor emission rates (in tpy) that would result in concentrations equal to the PSD SILs.
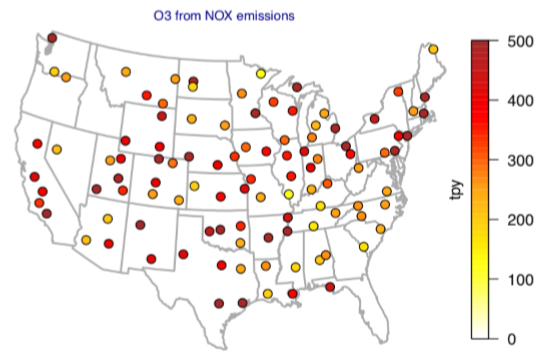
The modeling revealed that local/regional differences in climate and air quality have significant impacts on the MERP values for different regions. The U.S. EPA image below shows the locations of each modeled hypothetical source and how the MERPs for O3 from NOX emissions vary across the country. NOX MERPs for O3 can vary from 125 tpy to well over 500 tpy.
The U.S. EPA also made several updates in the new guidance compared to the December 2016 draft:
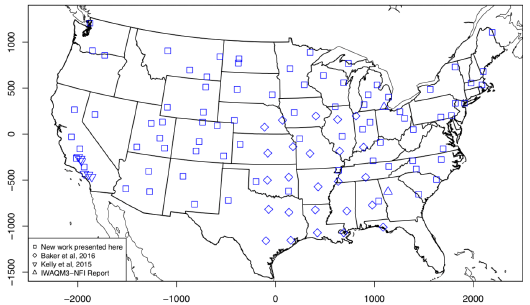
- More hypothetical sources have been added in more places, as shown in the image below;
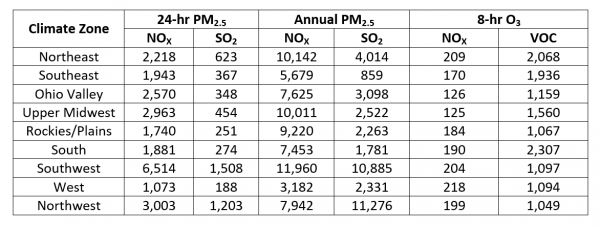
- Sources are now categorized by NOAA Climate Zone, as shown in the image below;
- Additional information has been provided for hypothetical sources, which will aid in determining the most representative hypothetical source to your facility:
- Coordinates;
- Maximum terrain height within 50 km; and
- Fractional urban coverage within 50 km); and
- An external spreadsheet of modeling results and source information has been made available; and
- More examples have been provided regarding how to apply MERPs in permitting situations.

The MERPs outlined in the new guidance provide a framework for calculating concentrations of secondarily formed PM2.5 and O3. The network of hypothetical sources evaluated by the U.S. EPA can provide representative estimations of secondary pollutant impacts near a project source and relieve both industry and regulators from performing detailed photochemical modeling for single-source permit applications.
In a typical SIL analysis for a PSD permit application, an applicant could use the conservative MERPs values shown above to estimate the quantities of PM2.5 and O3 formed as a result of their precursor emissions. In the case of O3, the quantity formed by both NOX and VOC are summed and compared to the O3 SIL. Similarly, the secondary PM2.5 formed by SO2 and NOX are added to the maximum modeled concentrations of direct PM2.5. In each case, the resultant concentration is compared to the applicable SIL. If the total is less than the SIL, then no further analysis is required. If the SIL is exceeded, then a more detailed analysis is needed.
Looking Forward
The U.S. EPA intends to periodically update its MERPs spreadsheet when additional modeling analyses are conducted, which is good news for everyone, especially for facilities in locations with no nearby hypothetical sources. The guidance includes information for developing additional MERPs, which some states may opt to do as part of their state-specific implementation of this guidance.
While the federal guidance provides a general framework for the use of MERPs in permitting situations, each state has flexibility in its implementation within their own states. Many states have already begun developing state-specific MERPs implementation guidance, including Georgia, Texas, and Kentucky. Now that the federal guidance has been finalized, expect to see more states updating their modeling guidance to include MERPs implementation.
If you’re currently dealing with a project that involves air quality modeling or have other questions about MERPs, feel free to reach out to Kristin Fritchman at (314) 447-3623 or at kfritchman@cecinc.com. She’s always happy to discuss air quality!
Post a Comment